
"Knightica pulled our whole operation into one place. For the first time we see real cost-to-complete on every site as it happens, not weeks later, so we catch overruns while we can still do something about them. The manual reporting is gone and my team has its time back. Sharp, reliable, and a real step change for how we run projects."
Client snapshot
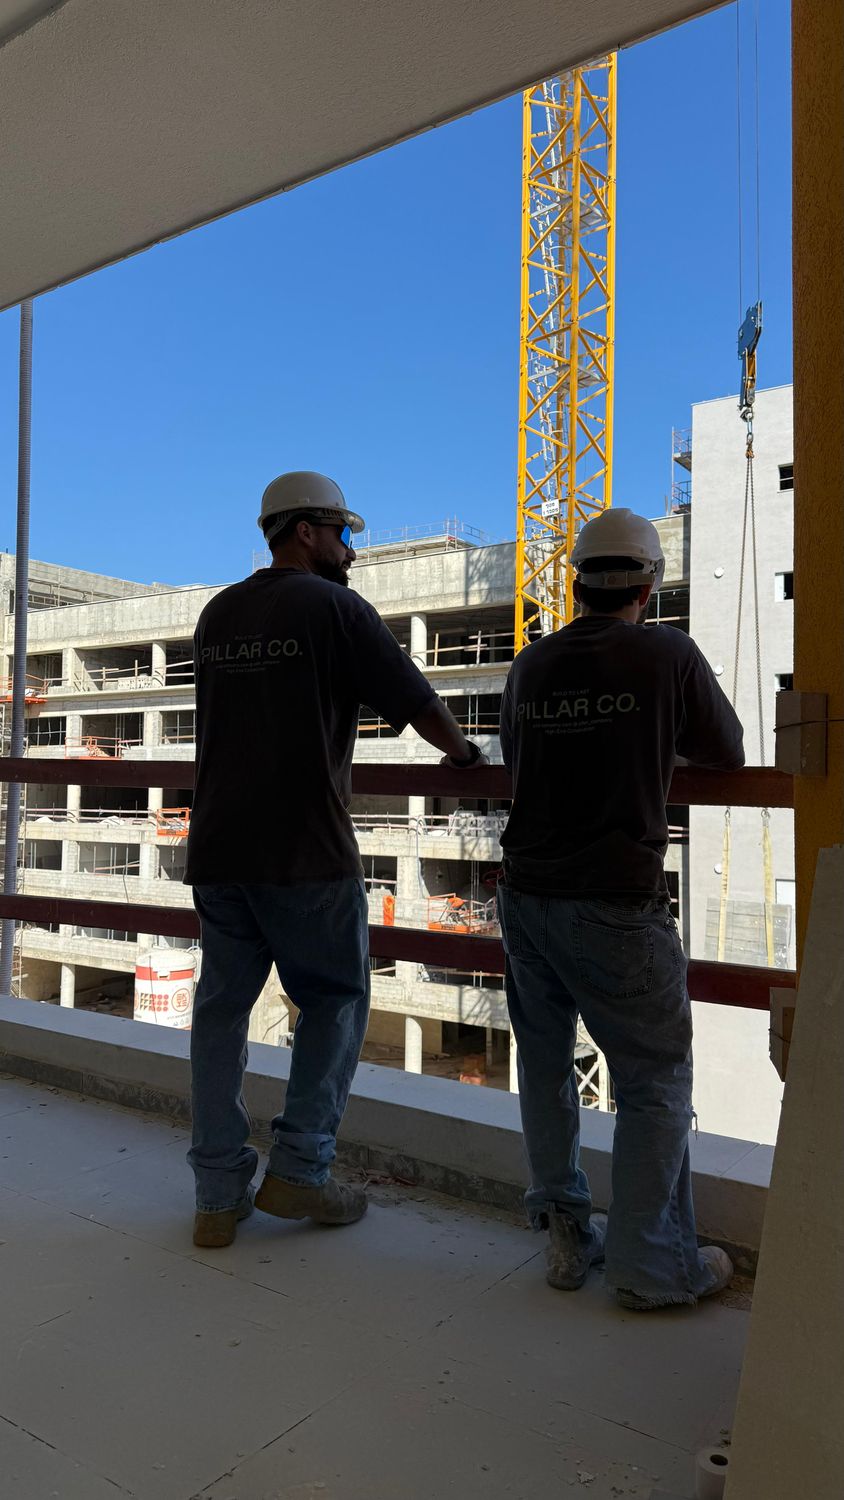
Pillar Co. is a construction company running several active sites at once, with project managers, subcontractors and suppliers moving in step on every one of them. Each project is a moving budget of materials, labor and deadlines, and Pillar delivers them side by side.
Overruns surfacing weeks too late
No field visibility
Project managers and subcontractors had no way to see or update progress themselves, every status update traveled by phone call or text.
Hand reconciliation
Budgets, subcontractor invoices, material orders and site progress matched up manually, line by line.
Late overruns
By the time a budget line broke, weeks had passed and the cheap moment to fix it was gone.
Reports by hand
Management's margin picture depended on someone in finance assembling a report manually, every time.
Mapping the money
Traced how budgets, purchase orders, subcontractor costs and site progress actually flow across every active project.
One operations layer
Built the single live view that pulls every site's budget, purchase orders, costs and progress into one place.
Automatic matching
Invoices and material orders flow in automatically, get matched to the budget line they belong to, and flag any overrun the moment it appears.
Sites onboarded
Every active site runs in the live view, with project managers and finance working off the same numbers.
Weekly reports live
Automated reports reach management with real cost-to-complete per project, no hand-built spreadsheets.
Real-time control
Overruns get caught while they can still be fixed, and decisions run on current numbers instead of last month's.
Tasks & Workforce
- Every project manager and subcontractor logs into one CRM, with role-based access to their sites
- Site progress and tasks updated directly from the field, in real time
- Workforce assignments and crew scheduling managed from the same system
- Every task tied to a site and an owner, so nothing falls through the cracks
Materials, Budget & Inventory
- Every site's budget, purchase orders and materials inventory in one live view
- Material orders tracked from request to delivery, matched automatically to their budget line
- Overruns flagged the moment they appear, not weeks later
- Weekly reports give management a real cost-to-complete and margin picture, with no hand-built spreadsheets